Roman Interactive Sensitivity Tool

The Roman Interactive Sensitivity Tool (RIST) is a simulation tool designed to help users quickly explore the feasibility of point source observations with the Roman Wide Field Instrument (WFI). RIST is available on GitHub as a Jupyter Notebook.
Software Freeze: To ensure a stable user experience, updates to certain Roman tools will be suspended from June 28, 2026 through commissioning. Exceptions may be made for urgent fixes. Users will be notified of any releases made during this period.
RIST Overview
RIST is a simplified and interactive version of Pandeia (the Exposure Time Calculator, or the ETC) and uses a pre-computed grid of Pandeia results that samples a set of exposure parameters and observing setups. RIST provides users an estimate of signal-to-noise ratio (SNR) in their observation based on the selected source brightness, spectral energy distribution (SED) type, normalization type, multi-accumulation (MA) table, and background locations. To do this, RIST interpolates within a grid of pre-computed results, assuming a single on-axis point source. Because the results are pre-computed, RIST offers less flexibility in the design of scenes (e.g. point sources only) and observations, but is useful when needing quick SNR estimates of point sources.
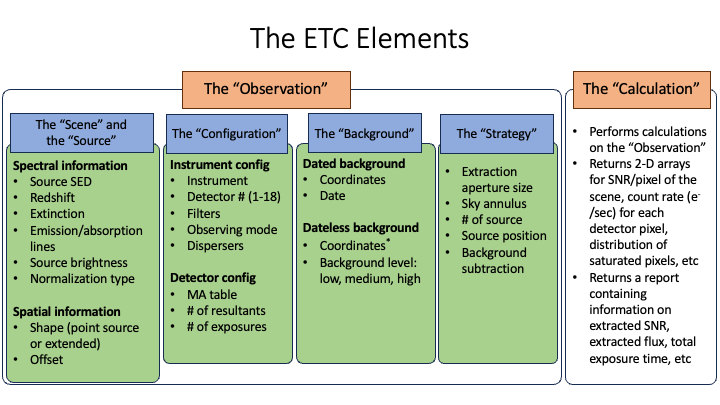
The Figure of the Elements of Pandeia ETC shows the different elements that can be specified in Pandeia calculations. Additional information on Pandeia can be found in the Pandeia for Roman article.
Figure of the Elements of Pandeia ETC
RIST and Other Roman Tools
RIST is designed to provide users a quick estimate of SNR for the WFI observations with a few user-specified parameters. For users interested in higher-fidelity calculations of SNR, we recommend using the WebETC or Pandeia . These tools allow for the fine-tuning of input sources and observatory setups, and can be used in parallel with APT.
More information on these other tools can be found in the guide to selecting Roman Simulation Tools.
RIST Interface
RIST is designed to work within a Jupyter notebook cell (hosted on GitHub here). The RIST interface can be initialized by importing the plot_rist module. The Figure of RIST Interface shows the initialized RIST interface. Users can control the parameters from the left and can get the estimated SNR from the plot on the right.
Each dot in the interactive plot represents the SNR for each of the eight WFI filters. Hovering the mouse over the points will print the value of the SNR rounded to the nearest integer and the name of the filter. The names are also shown in the legend on the right.
Figure of RIST Interface
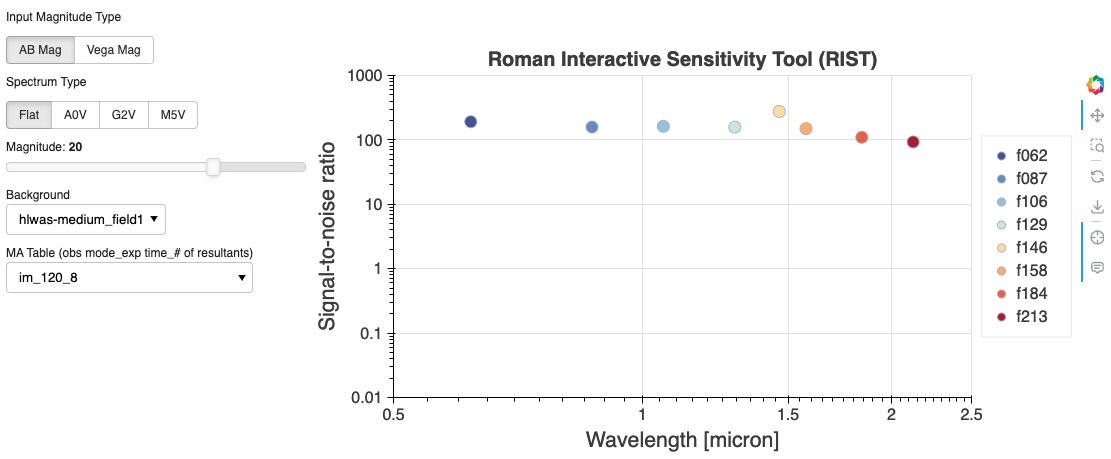
A screen capture of the RIST interface. From the left, users can control the parameters and get the estimated SNR from the plot on the right.
Fixed Parameters of RIST
By design, RIST uses a simple source and observatory setup for the benefit of much faster SNR calculations. Here, we explain in detail the default setup used to generate the grid of pre-computed Pandeia results used by RIST.
- The source is set to
- A single point source
- No redshift, no extinction, and no emission and absorption lines.
- The instrument and the detector configurations are set to
- The imaging mode of the WFI
- Detector 1 (WFI01)
- On-axis source at the center of the detector
- Single exposure
- Compute SNR for all eight Roman filters
- The number of resultants is set to the maximum resultants for each multi-accumulation (MA) table
- As of Pandeia version R2025.9, RIST no longer supports truncation of the MA tables, as it may result in undesirable effects on the data and observations (e.g. data volume for data downlink capabilities, and larger overheads due to telescope slew & settle). If you need to explore shorter exposure times than what is available in RIST, you can still use the Pandeia engine to explore the MA table truncation options, but caution is needed when considering the truncation.
- The extraction strategy is set to have
- The aperture size of 0.2’’ for the source
- The sky annulus of 0.4’’ and 0.6’’, for the inner and outer radius, respectively, for the background subtraction
Tunable Parameters of RIST
RIST offers different options for four parameters either through drop-down menus or a slider.
- Magnitude system: Two options are available between the AB magnitude and the Vega magnitude
- SED types: Four options are available from flat, A0V, G2V, and M5V
- Source magnitude: the source magnitudes are available from 29th magnitude up to 16th magnitude in each of the magnitude system.
- Backgrounds: six locations in the High Latitude Wide Area Survey (HLWAS), one location for the High Latitude Time Domain Survey (HLTDS), and one location for the Galactic Bulge Time Domain Survey (GBTDS). The backgrounds are computed at 'medium' level at each location. Please refer to the Pandeia Engine & Roman Interactive Sensitivity Tool (RIST) section in the Assessing Background Levels for WFI Observations article for more information.
- MA tables: the MultiAccum (MA) tables describe how the up-the-ramp sampling is performed using the sequence of individual reads on the WFI detectors. RIST offers 33 MA table options.
- MA table naming convention:
obs mode_exp time_number of resultants.'_s'at the end of the name indicates 'sparse fields only'obs modeis either 'im' for the imaging or 'sp' for the spectroscopic mode (currently not supported by RIST), respectively.exp timeis the effective exposure time in secondsnumber of resultantsis the number of samples up-the-ramp that will be downlinked from the telescope
- Please refer to the MA Table page for more information on the MA tables.
- MA table naming convention:
The Figure of Configuring RIST highlights the default and configurable elements of RIST, as described above. The elements in yellow represent the ‘Default’ setup of RIST and the elements in red represent the ‘Parameters’ of RIST with which users can explore the feasibility of their science with the WFI.
Figure of Configuring RIST
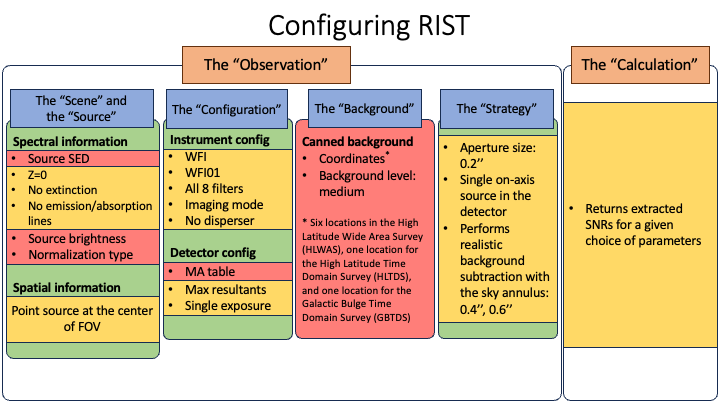
An overview of the default (yellow) and configurable (red) elements of RIST.
RIST is designed using the bokeh Python package. Its interactive plot tools offer additional features that can be enabled and disabled by clicking on the icon, respectively.
- The Bokeh website (
 ) opens the Bokeh website
 - The Pan (
 ) tool allows users to pan the plot without changing the plot scale.
 - The Box Zoom (
 ) tool allows users to draw a box to zoom in on a particular part of the plot
 - The Reset (
 ) tool allows users to revert the plot back to its original scale
 - The Save (
 ) tool saves the current plot as a PNG format and downloads the image to the Downloads folders
 - The Crosshair (
 ) tool draws a crosshair annotation over the plot
 - The Hover (
 ) tool shows the annotations when a mouse cursor is over the points
Limitations of RIST
RIST inherently has the same limitations as Pandeia . Please see the Caveats of using Pandeia for Roman article for the details on these limitations for Roman.
The current version does not handle the following features and users need to use Pandeia for:
- Extended sources: all SNR computations are performed for a point source.
- The spectroscopic observing mode: future versions of RIST will support the spectrocopic mode.
Software Release
RIST will be updated every time Pandeia and its reference files are updated, and a new grid of pre-computed results will be generated. The current grid is generated using the versions of Pandeia and its reference data:
- Pandeia Engine version: R2026.1
- Pandeia Refdata version: R2026.1
- Pandeia PSF version: R2026.1
For additional questions not answered in this article, please contact the Roman Help Desk.