Roman Background Visualization Tool

The Roman Background Visualization Tool (RBVT) is an interactive tool that allows users to explore the near-infrared sky background observed by the Roman Wide Field Instrument (WFI), as a function of sky position, day of year, and wavelength.
Software Freeze: To ensure a stable user experience, updates to certain Roman tools will be suspended from June 28, 2026 through commissioning. Exceptions may be made for urgent fixes. Users will be notified of any releases made during this period.
The Roman Background Visualization Tool (RBVT) decomposes the background into zodiacal (Zodi), thermal, Interstellar Medium (ISM), and Cosmic Infrared Background (CIB) components and displays their contribution to the total background. RBVT is intended for quick-look background assessment prior to performing detailed exposure time calculations (see Roman WFI Exposure Time Calculator).
For additional information on the Roman background models, please also see the Assessing Background Levels for WFI Observations article.
Interested users can access the RBVT on GitHub, where it is distributed as a Jupyter Notebook.
RBVT Overview
The RBVT presents three plots that automatically update based on user input:
- Background vs Day: Shows the background level throughout the year for either a single optical element or all optical elements.
- When a single optical element is selected, the plot displays the individual background components (Zodiacal, Thermal, ISM + CIB) as well as the total.
When all filters are selected, only the total background for each optical element is shown.
- Background levels are computed at the optical element’s pivot wavelength only. This relies on the reasonable assumption that, over the optical element's wavelength range, the background spectral shape remains approximately constant.
- Spectrum on Selected Calendar Day: Displays the background spectrum as a function of wavelength for the specified sky position (RA, Dec) on the selected day of the year.
- Background Distributions by Optical Element (violin plot): Shows the annual distribution of total background values for each optical element’s pivot wavelength.
- The violin shape represents the full distribution of the annual background levels.
- The white box indicates the interquartile range (Q1–Q3), whiskers show the minimum and maximum, and the dot marks the median.
Single or multiple optical elements may be selected for comparison.
The RBVT relies on the Roman background model to display relevant data; more information on the model used is available here.
RBVT and Other Roman Tools
The RBVT is ideal for visualizing the sky background, but for detailed scene configuration or signal-to-noise calculations, users should refer to the Roman Exposure Time Calculator (ETC), which incorporates the same background model.
A typical workflow is to first use the RBVT to identify favorable observing dates, wavelengths, or fields with low background, and then carry those selections into the ETC for full sensitivity and exposure time analysis.
RBVT Interface
The RBVT interface runs as a bokeh application within a Jupyter notebook. Controls on the left drive all three plots:
- Sliders & Inputs: RA, Dec, Threshold, and Calendar Day. Each slider has a matching numeric text input; changing either updates the plots. The Calendar Day slider defaults to the nearest day modeled.
- Component Toggles: Checkboxes show/hide Total, Zodi, Thermal, and ISM + CIB consistently across plots.
- Filter View: A Show all elements checkbox and a Single element selector control which filters are shown.
- Export: There are three buttons for each plot that can be used to save the current data shown in
csvformat. Each plot can also be saved aspngfiles using the Save button on the right side of each plot.
Figure of the RBVT Graphical Interface
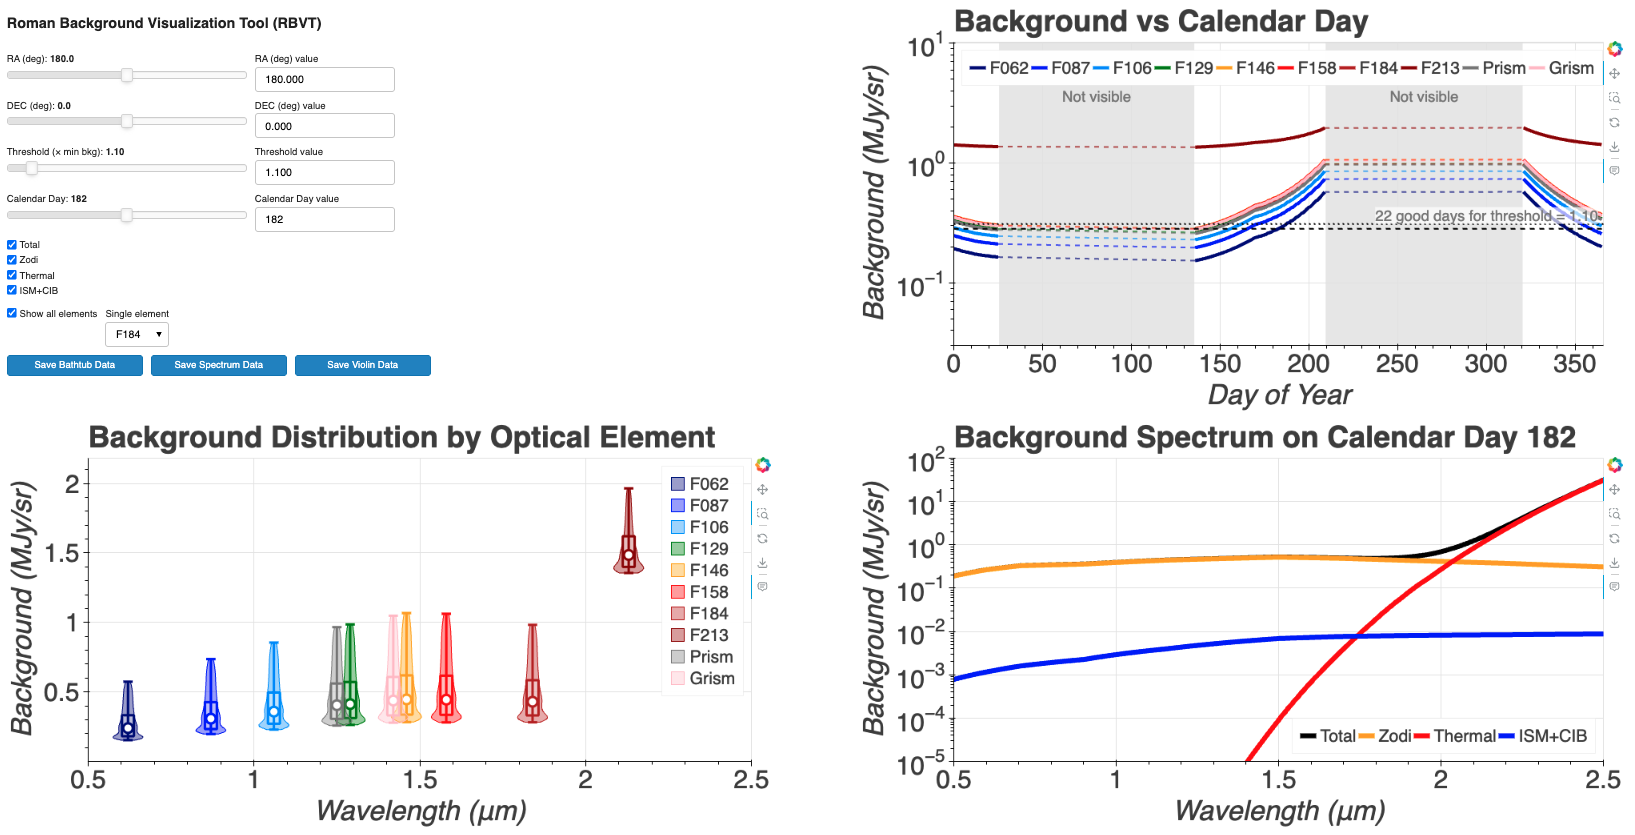
A screen capture of the RBVT interface. From the top left, users can control the parameters and get the background spectrum for a specific calendar date.
Fixed Parameters of RBVT
The RBVT uses a consistent modeling setup via the internal background (RA, Dec, wavelength, threshold) function:
- Data Products: A wavelength grid (∼0.5–2.5 μm) and a calendar grid (subset of 0–365 where the model is defined, day 0 corresponds to Jan 1st), with arrays for zodi, thermal, ISM + CIB, and total backgrounds.
- Bathtub: For any wavelength, RBVT computes the per-day background terms; thermal/ISM are constant across the year for a given setup, while the zodi varies with the viewing geometry.
- Units/Scaling: Backgrounds are in MJy/sr and displayed on log axes.
Tunable Parameters of RBVT
Users can adjust:
- RA, Dec (deg): Sky position.
- Threshold (× min background): The optional threshold parameter is defined as a multiplier relative to the minimum background. It is used in the underlying logic to highlight or exclude days and controls the number of “good” days displayed in the background-versus-calendar-day plot.
- Calendar Day: Selects the spectrum slice; input is snapped to the nearest modeled day.
- Components/Elements: Show/hide individual background components; switch between all optical elements or a single element for overlays/violins.
In addition, the bokeh interactive plot tools offer additional, standard features that can be enabled and disabled by clicking on the icon, respectively:
- The Bokeh website (
 ) opens the Bokeh website
 - The Pan (
 ) tool allows users to pan the plot without changing the plot scale.
 - The Box Zoom (
 ) tool allows users to draw a box to zoom in on a particular part of the plot
 - The Reset (
 ) tool allows users to revert the plot back to its original scale
 - The Save (
 ) tool saves the current plot as a PNG format and downloads the image to the Downloads folders
 - The Hover (
 ) tool shows the annotations when a mouse cursor is over the points
Violin Plot
A Violin plot allows for a quick look at the overall distribution of the background levels throughout the year for each optical element, including quartiles information as well as the density distribution of the background levels.
For each element’s pivot wavelength, the violin plot is calculated by:
- Collecting the total background across all modeled days at the closest wavelength sample.
- Computing quartiles in linear space: Q0 (min), Q1 (25%), Q2 (median), Q3 (75%), Q4 (max). The white box spans Q1–Q3; the dot marks Q2; whiskers show Q0 and Q4.
- Building the violin’s shape via Kernel Density Estimation (KDE) in log space. This is done by estimating the density of log10 background values, normalizing its peak to 1, and mapping that density to a symmetric half-width about the filter’s central wavelength, yielding a smooth, log-aware silhouette.
Violin Plot for the Background as a function filter
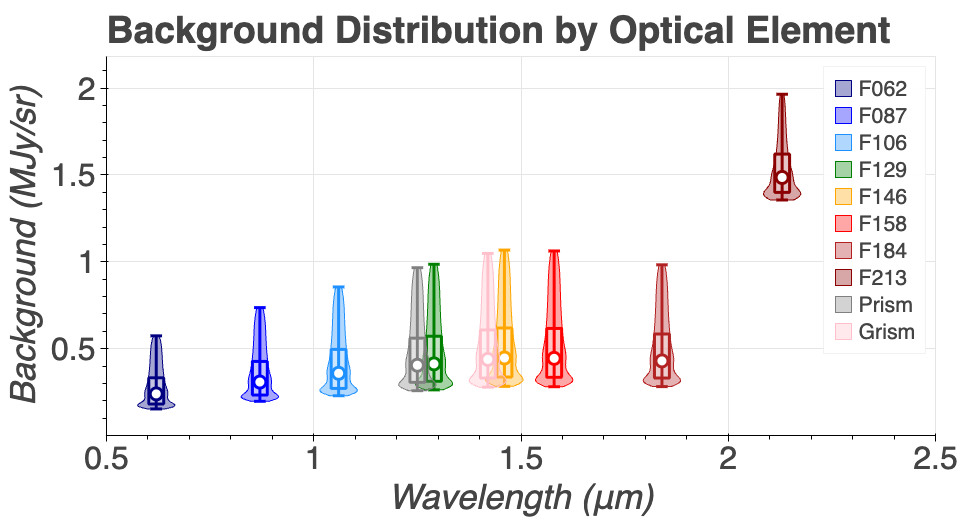
A screen capture of the RBVT violin plot showing the distribution of the annual background levels for each filter. The rectangular boxes indicate the interquartile range (25th–75th percentiles), the open circle shows the median, the whiskers show the minimum and maximum values, and the violin-shaped overlays represent the density distribution of the background levels.
Limitations of RBVT
- Backgrounds only: RBVT only display background information, and does not compute the signal-to-noise ratio or includes detector effects. For such calculations, users should refer to the Roman ETC.
- Optical elements bandpass treatment: Measurement use the element's pivot wavelength only, i.e. there is no full bandpass integration.
- Sampling: Calendar days depend on model availability, the RBVT defaults to the nearest day. Spatial variations within a WFI field are not modeled.
Software Release
The RBVT is implemented in Python with
bokeh
(tested with version 3.8), numpy, and pandas.
For additional questions not answered in this article, please contact the Roman Help Desk.