Gap-filling Dithers

Gap-filling dithers are large telescope slews designed to fill the gaps between Roman’s Wide-field Instrument (WFI) detectors with overlapping pointings, while also mitigating bad pixels and detector systematics. These dithers are organized into two main geometries: positions arranged along a line (LINEGAP) and positions distributed within a box (BOXGAP). Each geometry includes multiple pattern variants that differ in the number and arrangement of pointings, allowing coverage and exposure depth to be optimized for different observing goals. This article describes LINEGAP and BOXGAP gap-filling dither patterns in detail.
GAP dither patterns are large-scale shifts that require telescope slews. These patterns are designed to mainly fill in the gaps between the WFI detectors with pointings that slightly overlap, but also has some other uses; avoid bad pixels (hot or dead pixels or those affected by cosmic ray hits), reduce inter-detector and intra-detector systematics.
Changes to the technical details and other specifications presented here are expected as a part of pre-launch development. This includes modifications to the dither patterns.
A dither pattern is characterized by two main features: the geometric arrangement of the pointings and the total number of pointings. We consider two geometries: (1) pointings arranged along a line, referred to as LINEGAP, and (2) pointings arranged in a box, referred to as BOXGAP. The LINEGAP series includes dither patterns with 2, 3, 4, or 5 pointings, while the BOXGAP series includes dither patterns with 4, 5, 6, 7, 8, or 9 pointings. For each geometry and number of pointings, multiple variations are defined. Dither pattern names encode the geometry, the number of pointings, and a variation index. For example, BOXGAP3_4 denotes a box geometry with three pointings and the fourth variation of that configuration. Gap-filling dither patterns may also include sub-pixel (SUB) dither patterns executed at each pointing. In total, 28 unique gap-filling dither patterns are available. The Figure of All Gap-filling Dither Patterns provides a concise visual reference for these configurations.
Figure of All Gap-filling Dither Patterns
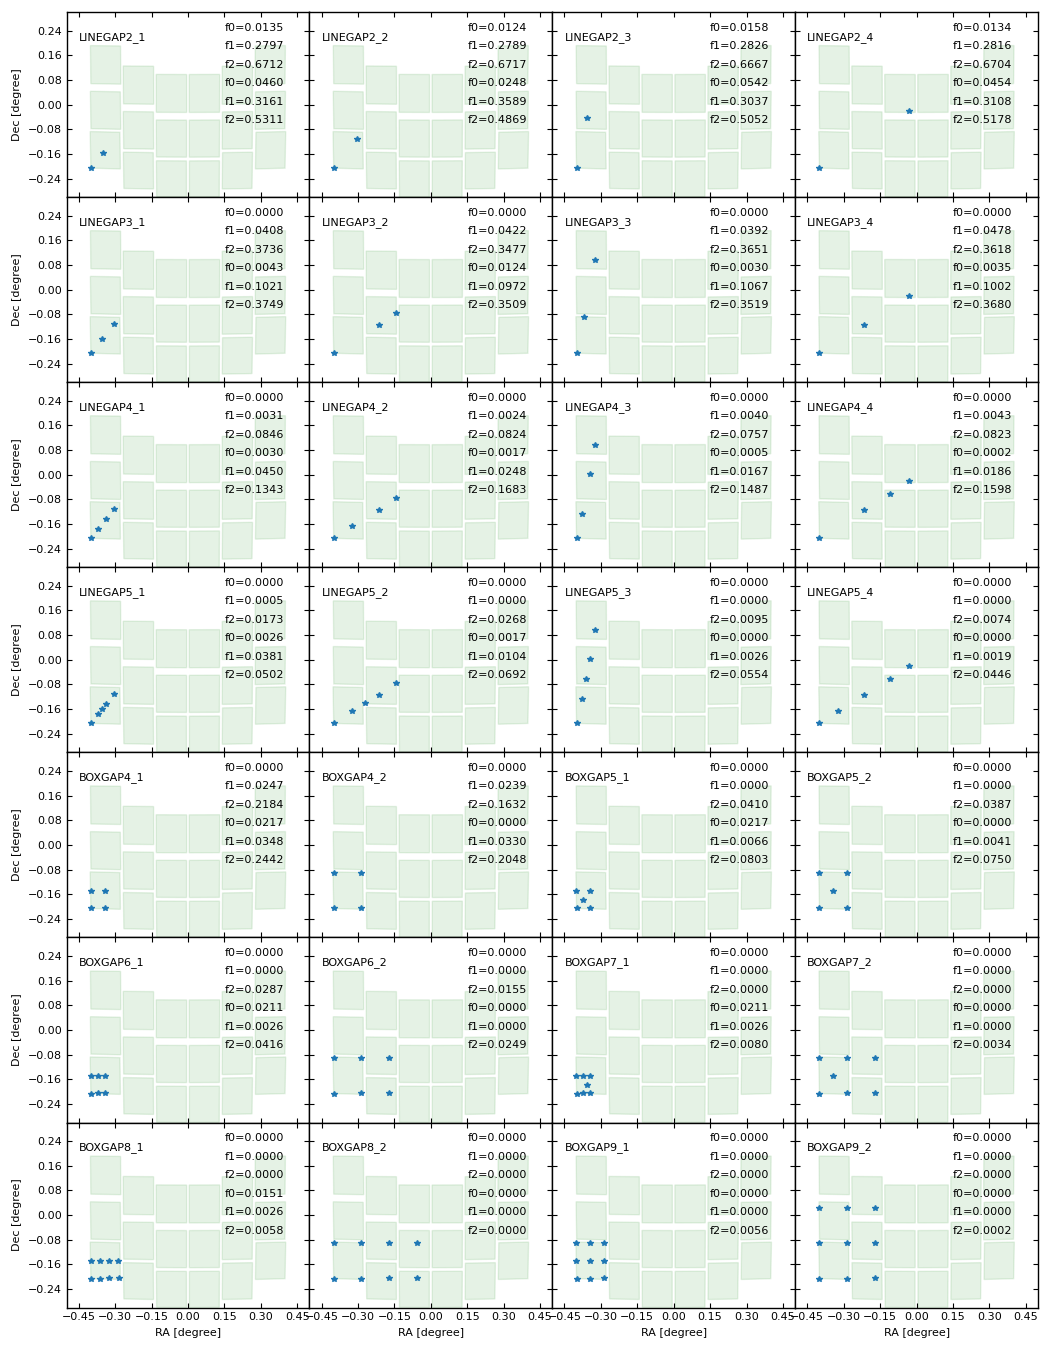
Reference graphics for the 28 dither patterns available for Roman. Each panel shows a single dither pattern showing all of the LINEGAP patterns and then the BOXGAP patterns in order of number of pointings. The WFI footprint is shown in green at the first dither step and the blue stars show the other dither positions relative to the first step. As described in Computation of Coverage Statistics for GAP Dither Patterns, the coverage fractions (f0, f1, f2) are shown. The coverage fraction represents the fractional area with an equivalent depth of 0, 1, or 2 images in cases where the tiles in the mosaic pattern are aligned (top three numbers) or unaligned (bottom three numbers). In the section Dither Patterns, figures are provided for each pattern to show the exposure depth and are organized by number of pointings.
Computation of Coverage Statistics for GAP Dither Patterns
Dither patterns for Roman were optimized based on their coverage fractions when executed within mosaic patterns. The Figure on Computation of Coverage Fraction shows an example 3x3 mosaic pattern, with an inscribed black rectangle of size 0.79° x 0.395°. The area of this rectangle is slightly smaller than the outer bounding rectangle of a WFI tile. Coverage fractions are computed inside this region in order to account for exposure contributions from neighboring tiles in the mosaic pattern. For users executing a dither pattern outside the context of a 3×3 mosaic pattern, we recommend designing the observations in APT and using the Roman Footprint Visualization Tool to visualize the resulting coverage.
The WFI detectors are arranged in an arched geometry. As a result, when constructing mosaic patterns, the coverage produced by gap-filling dithers depends on the relative alignment of tiles that are adjacent in the vertical (along-scan) direction. Specifically, gaps can occur when the left and right edges of a tile are not vertically aligned with the corresponding edges of the tiles immediately above or below it. For small mosaics, it is often possible to maintain this vertical edge alignment between vertically adjacent tiles. However, for large mosaics—or when mosaics are tiled to cover extended target regions—spherical geometry generally prevents all vertically adjacent tiles from remaining aligned. In these unaligned configurations, residual gaps can persist between dithered exposures, even when gap-filling dither patterns are applied. The Figure on Computation of Coverage Fraction illustrates this effect: the left panel shows a mosaic in which vertically adjacent tiles are aligned, resulting in nearly uniform coverage after applying gap-filling dithers, while the right panel shows a mosaic with misaligned vertically adjacent tiles, where gaps remain. The qualitative difference in coverage between the two cases is clearly evident.
Quantitative coverage fractions are provided for each of the 28 gap-filling dither patterns in both aligned and unaligned cases. Coverage fractions are provided in terms of the fractional area, fn (in percent), that receives contributions from a number of images, n. The quantity fn therefore provides also an estimate of the total area reaching a given depth, expressed in units of exposures. Because these coverage fractions are computed in the context of mosaic patterns, the number of contributing images is generally larger than the number of pointings in an individual gap-filling dither pattern. In general, a minimum of three pointings (P = 3) is required to eliminate gaps; quantitatively, gaps correspond to coverage fractions with f0 > 0%. This occurs because the WFI detectors are not uniformly spaced.
Coverage fraction statistics for the aligned case are given in the Table of Coverage Statistics for Aligned LINEGAP Dither Patterns and the Table of Coverage Statistics for Aligned BOXGAP Dither Patterns for the line and box geometries, respectively. Corresponding tables for the unaligned case are provided in a drop-down section below the aligned tables.
Figure on Computation of Coverage Fraction
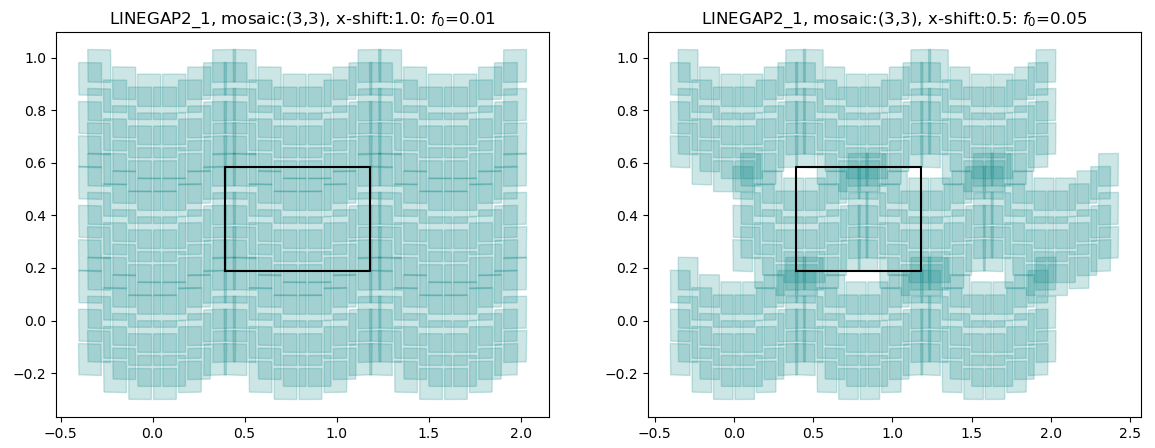
The black lines denote the fiducial rectangle that is used for computing the coverage fraction. It is of size 0.79° x 0.395° and is located at the center of 3x3 mosaic pattern. In the left panel, the left and right edges of WFI tiles are aligned vertically, while in the right panel they are displaced by half the width of a WFI tile.
Table of Coverage Statistics for Aligned LINEGAP Dither Patterns
| Dither Pattern | Percent of Area with Zero Exposures (f0) | Percent of Area with 1 Exp Depth (f1) | Percent of Area with 2 Exp Depth (f2) | Percent of Area with 3 Exp Depth (f3) | Percent of Area with 4 Exp Depth (f4) | Percent of Area with 5 Exp Depth (f5) | Percent of Area with 6 Exp Depth (f6) | Percent of Area with 7 Exp Depth (f7) | Percent of Area with 8 Exp Depth (f8) |
|---|---|---|---|---|---|---|---|---|---|
| LINEGAP2_1 | 1.35% | 27.97% | 67.12% | 3.52% | 0.03% | 0.01% | 0.00% | 0.00% | 0.00% |
| LINEGAP2_2 | 1.24% | 27.89% | 67.17% | 3.66% | 0.03% | 0.02% | 0.00% | 0.00% | 0.00% |
| LINEGAP2_3 | 1.58% | 28.26% | 66.67% | 3.44% | 0.03% | 0.02% | 0.00% | 0.00% | 0.00% |
| LINEGAP2_4 | 1.34% | 28.16% | 67.04% | 3.41% | 0.04% | 0.01% | 0.00% | 0.00% | 0.00% |
| LINEGAP3_1 | 0.00% | 4.08% | 37.36% | 53.63% | 4.82% | 0.08% | 0.02% | 0.00% | 0.00% |
| LINEGAP3_2 | 0.00% | 4.22% | 34.77% | 58.21% | 2.72% | 0.06% | 0.01% | 0.00% | 0.00% |
| LINEGAP3_3 | 0.00% | 3.92% | 36.51% | 55.33% | 4.18% | 0.05% | 0.01% | 0.00% | 0.00% |
| LINEGAP3_4 | 0.00% | 4.78% | 36.18% | 54.44% | 4.45% | 0.12% | 0.03% | 0.00% | 0.00% |
| LINEGAP4_1 | 0.00% | 0.31% | 8.46% | 42.15% | 43.45% | 5.43% | 0.16% | 0.03% | 0.00% |
| LINEGAP4_2 | 0.00% | 0.24% | 8.24% | 40.89% | 46.94% | 3.55% | 0.12% | 0.02% | 0.00% |
| LINEGAP4_3 | 0.00% | 0.40% | 7.57% | 40.98% | 46.06% | 4.88% | 0.09% | 0.01% | 0.00% |
| LINEGAP4_4 | 0.00% | 0.43% | 8.23% | 42.52% | 43.30% | 5.29% | 0.19% | 0.03% | 0.00% |
| LINEGAP5_1 | 0.00% | 0.05% | 1.73% | 13.01% | 43.35% | 35.41% | 6.17% | 0.24% | 0.04% |
| LINEGAP5_2 | 0.00% | 0.00% | 2.68% | 12.63% | 38.89% | 42.07% | 3.45% | 0.22% | 0.05% |
| LINEGAP5_3 | 0.00% | 0.00% | 0.95% | 12.55% | 42.62% | 38.45% | 5.30% | 0.12% | 0.01% |
| LINEGAP5_4 | 0.00% | 0.00% | 0.74% | 13.57% | 45.33% | 34.39% | 5.68% | 0.24% | 0.05% |
Table of Coverage Statistics for Aligned BOXGAP Dither Patterns
| Dither Pattern | Percent of Area with Zero Exposures (f0) | Percent of Area with 1 Exp Depth (f1) | Percent of Area with 2 Exp Depth (f2) | Percent of Area with 3 Exp Depth (f3) | Percent of Area with 4 Exp Depth (f4) | Percent of Area with 5 Exp Depth (f5) | Percent of Area with 6 Exp Depth (f6) | Percent of Area with 7 Exp Depth (f7) | Percent of Area with 8 Exp Depth (f8) | Percent of Area with 9 Exp Depth (f9) | Percent of Area with 10 Exp Depth (f10) |
|---|---|---|---|---|---|---|---|---|---|---|---|
| BOXGAP4_1 | 0.00% | 2.47% | 21.84% | 9.95% | 61.70% | 0.85% | 3.13% | 0.02% | 0.01% | 0.03% | 0.00% |
| BOXGAP4_2 | 0.00% | 2.39% | 16.32% | 19.41% | 57.95% | 2.05% | 1.82% | 0.03% | 0.02% | 0.00% | 0.00% |
| BOXGAP5_1 | 0.00% | 0.00% | 4.10% | 22.30% | 18.78% | 49.26% | 2.63% | 2.82% | 0.08% | 0.01% | 0.03% |
| BOXGAP5_2 | 0.00% | 0.00% | 3.87% | 17.70% | 27.17% | 46.13% | 3.41% | 1.63% | 0.07% | 0.02% | 0.00% |
| BOXGAP6_1 | 0.00% | 0.00% | 2.87% | 12.04% | 19.06% | 5.92% | 54.86% | 0.51% | 4.07% | 0.61% | 0.02% |
| BOXGAP6_2 | 0.00% | 0.00% | 1.55% | 5.59% | 23.95% | 20.38% | 43.45% | 2.82% | 2.13% | 0.09% | 0.04% |
| BOXGAP7_1 | 0.00% | 0.00% | 0.00% | 3.42% | 13.83% | 18.19% | 14.75% | 43.25% | 2.22% | 3.60% | 0.65% |
| BOXGAP7_2 | 0.00% | 0.00% | 0.00% | 1.81% | 8.18% | 24.82% | 24.41% | 35.11% | 3.57% | 1.96% | 0.10% |
| BOXGAP8_1 | 0.00% | 0.00% | 0.00% | 2.93% | 7.67% | 6.97% | 23.26% | 7.89% | 44.72% | 1.97% | 3.92% |
| BOXGAP8_2 | 0.00% | 0.00% | 0.00% | 0.34% | 3.31% | 8.30% | 28.84% | 16.72% | 36.42% | 3.41% | 2.48% |
| BOXGAP9_1 | 0.00% | 0.00% | 0.00% | 0.00% | 4.01% | 2.70% | 22.54% | 11.55% | 12.51% | 41.09% | 1.59% |
| BOXGAP9_2 | 0.00% | 0.00% | 0.00% | 0.00% | 2.68% | 5.63% | 15.26% | 15.81% | 23.72% | 31.26% | 2.65% |
The Dither Patterns
In the subsections below, each GAP dither patterns is shown for a single execution of the pattern. The patterns are organized by the number of dither positions, which range from 2 to 9, inclusive. For patterns with 4 and 5 positions, both line and box geometries are available. In the figures below, the transparency indicates the total depth achieved in a single execution of the dither pattern. Users may also combine gap-filling dither patterns described here with sub-pixel dither patterns (see Sub-pixel Dithers).
2 Point Dither Patterns
Figure of LINEGAP2 Dither Patterns
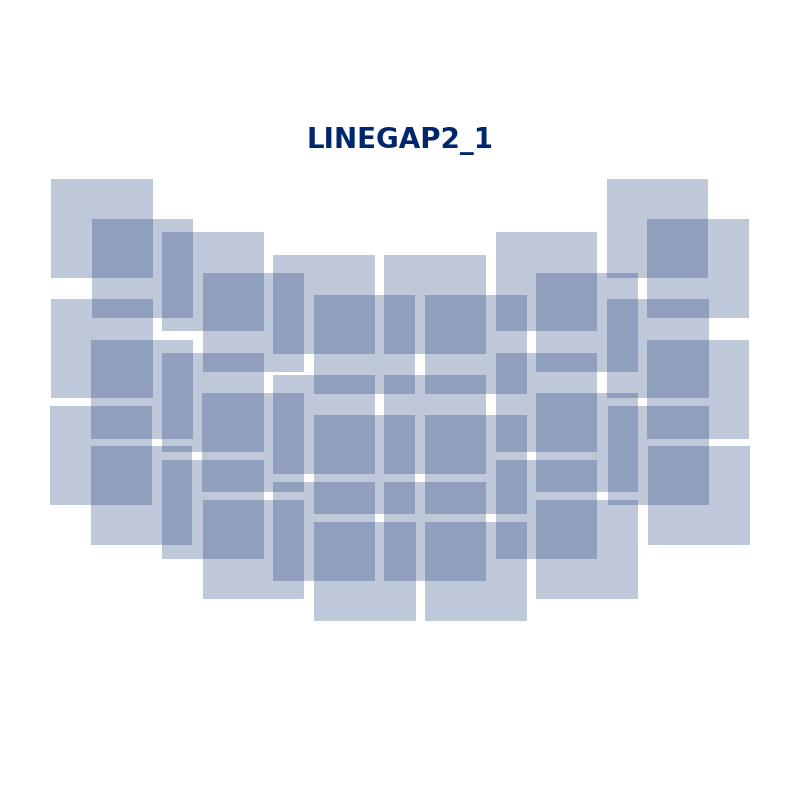
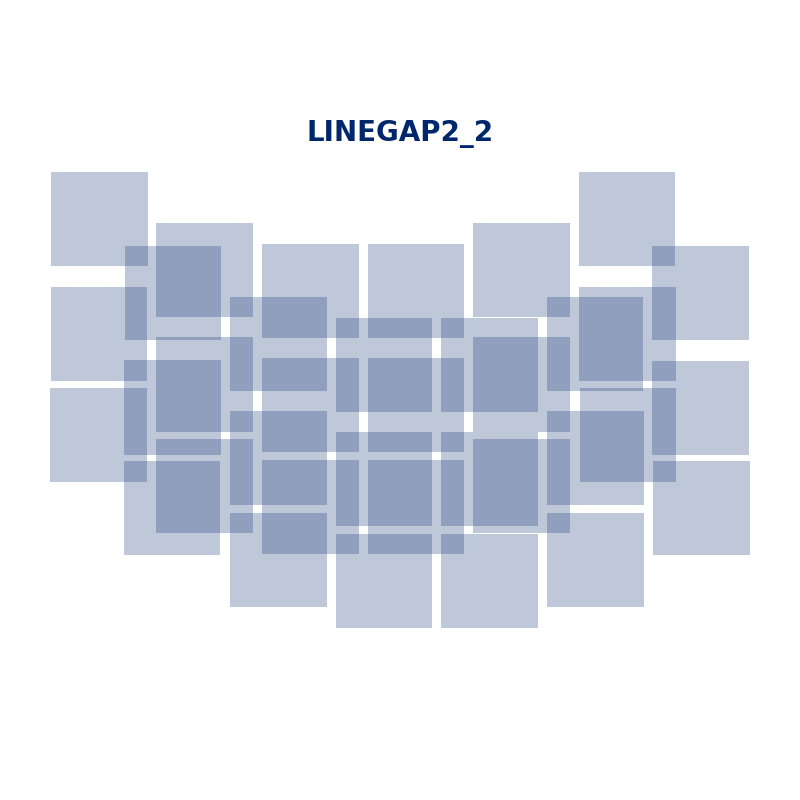
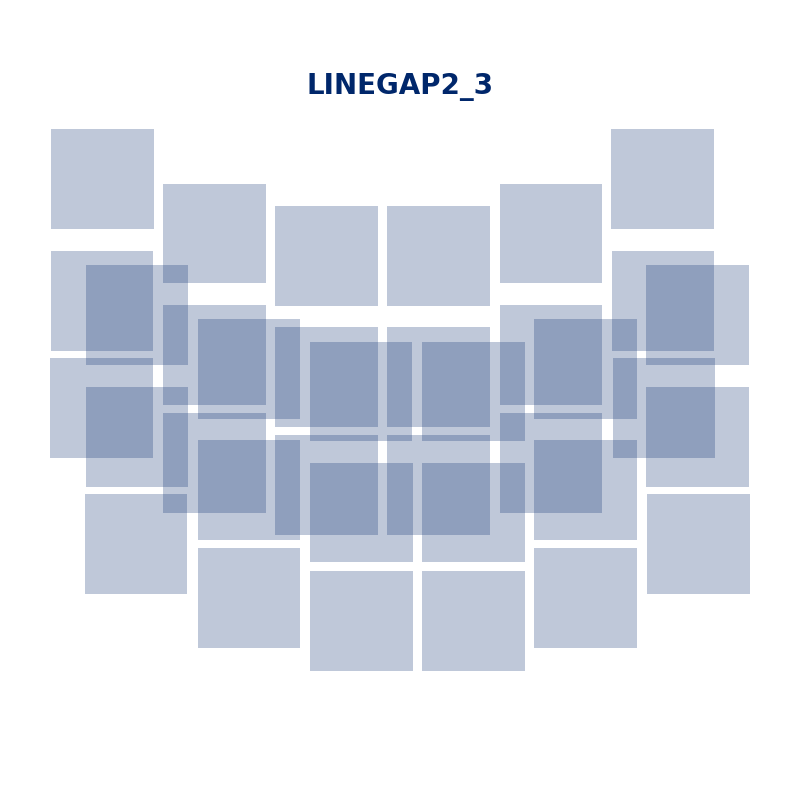
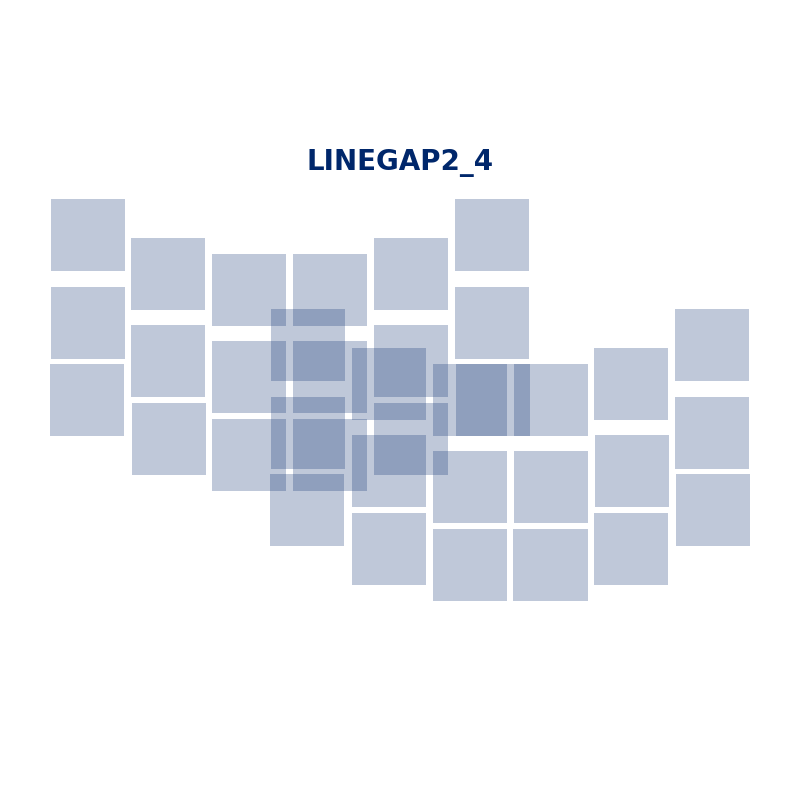
A schematic of the four different LINEGAP2 dither patterns is shown. The WFI footprints, each composed of 18 detectors, are transparent so that the overlapping parts of the footprints build up maps of the coverage as the transparency approaches the full color.
3 Point Dither Patterns
Figure of LINEGAP3 Dither Patterns
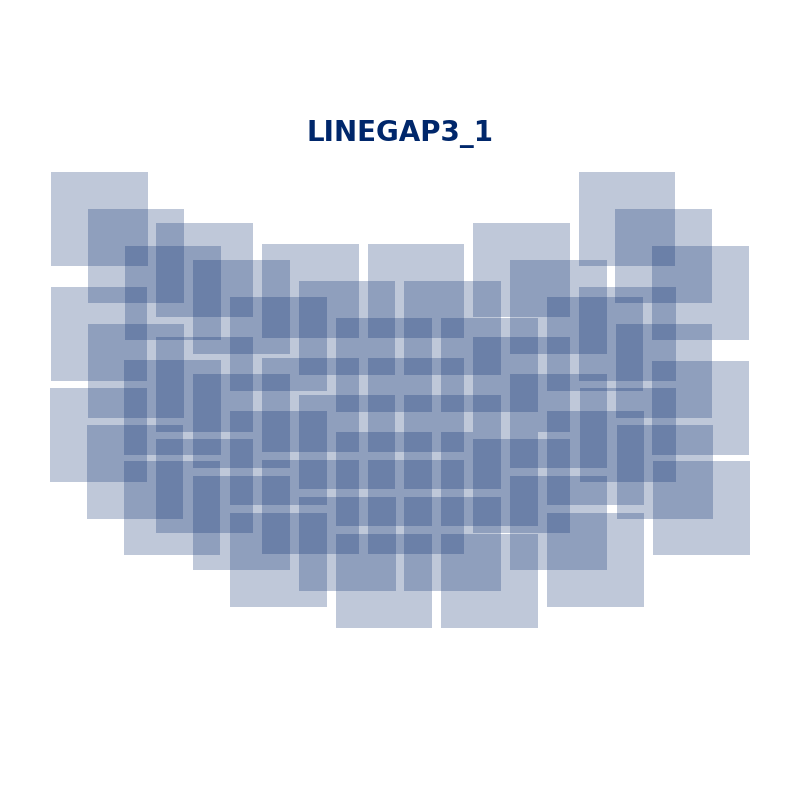
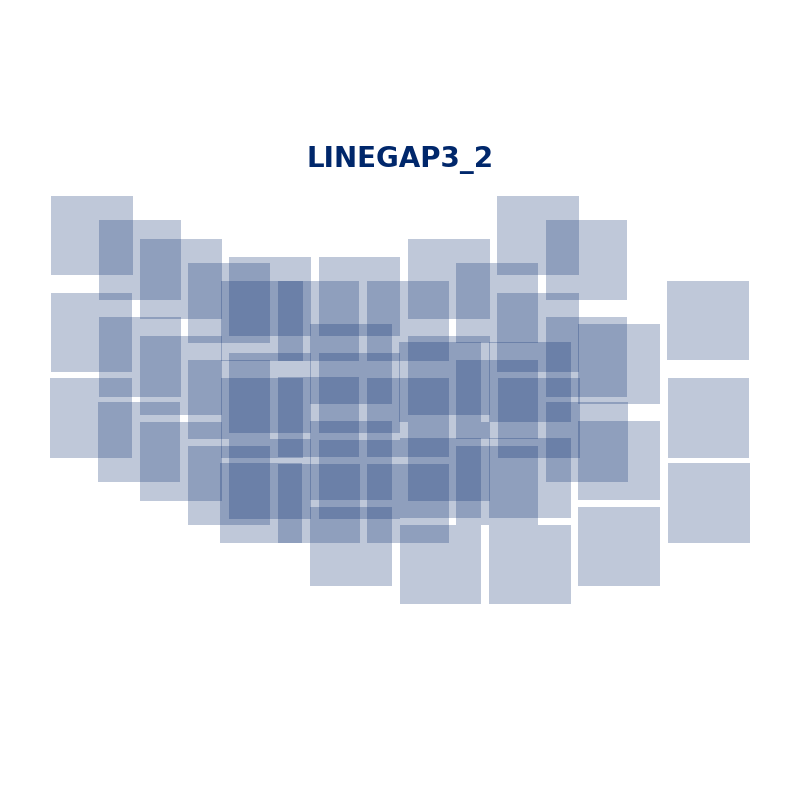
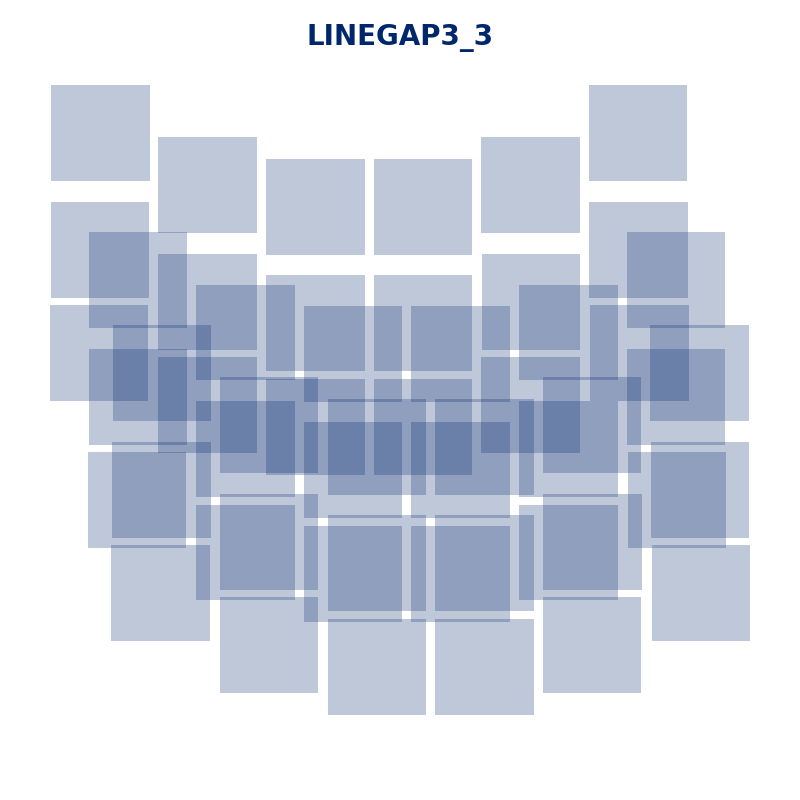
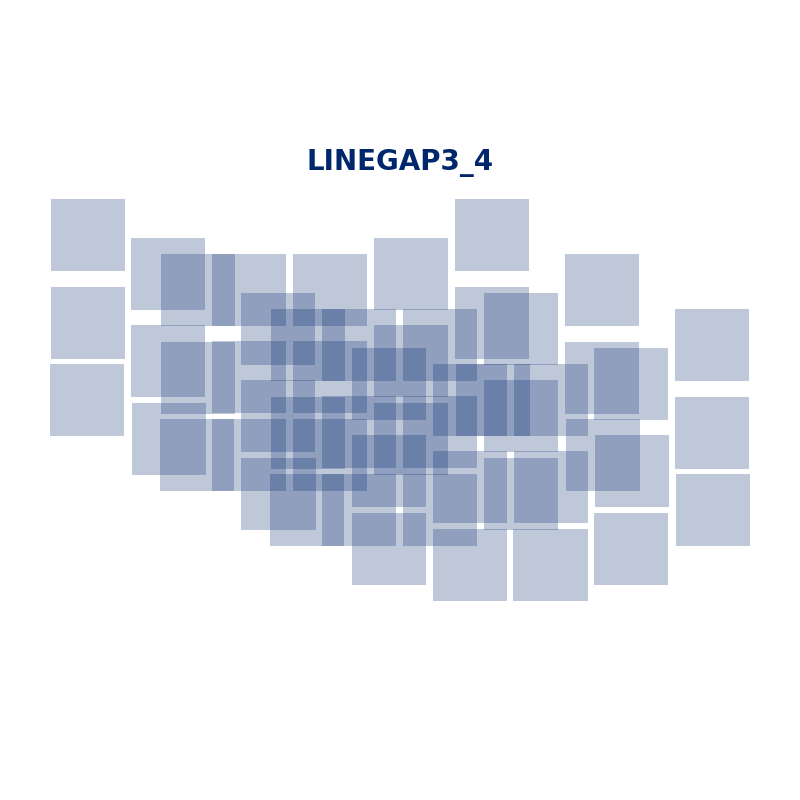
A schematic of the four different LINEGAP3 dither patterns is shown. The WFI footprints, each composed of 18 detectors, are transparent so that the overlapping parts of the footprints build up maps of the coverage as the transparency approaches the full color.
4 Point Dither Patterns
Figure of LINEGAP4 Dither Patterns
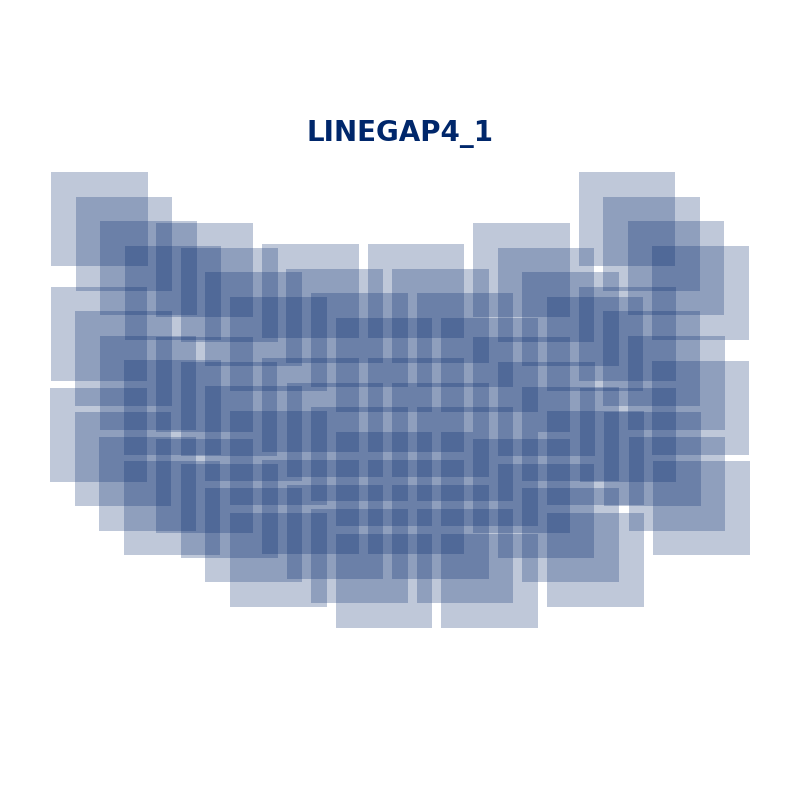
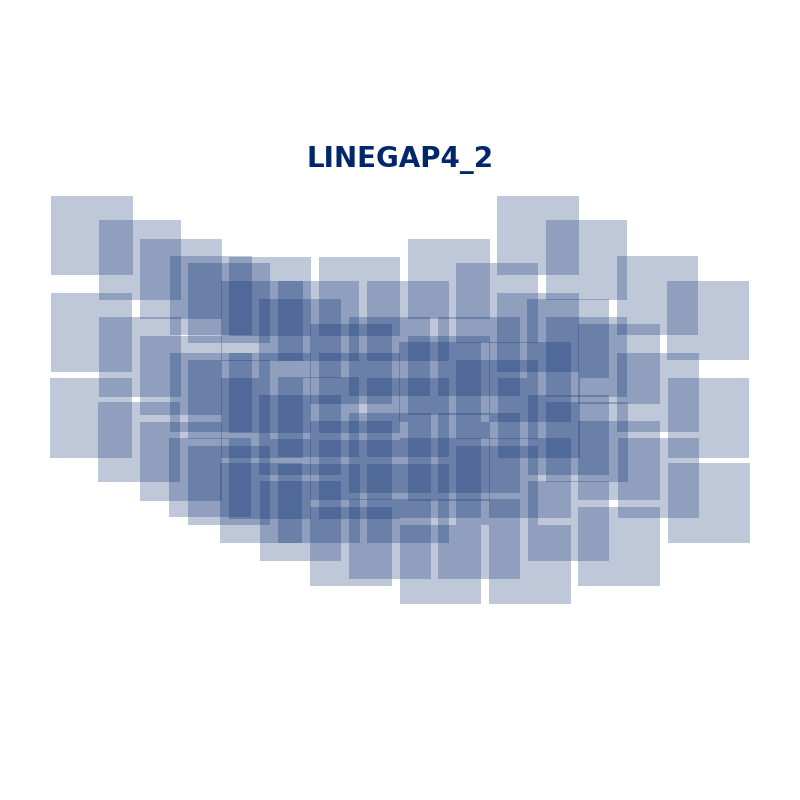
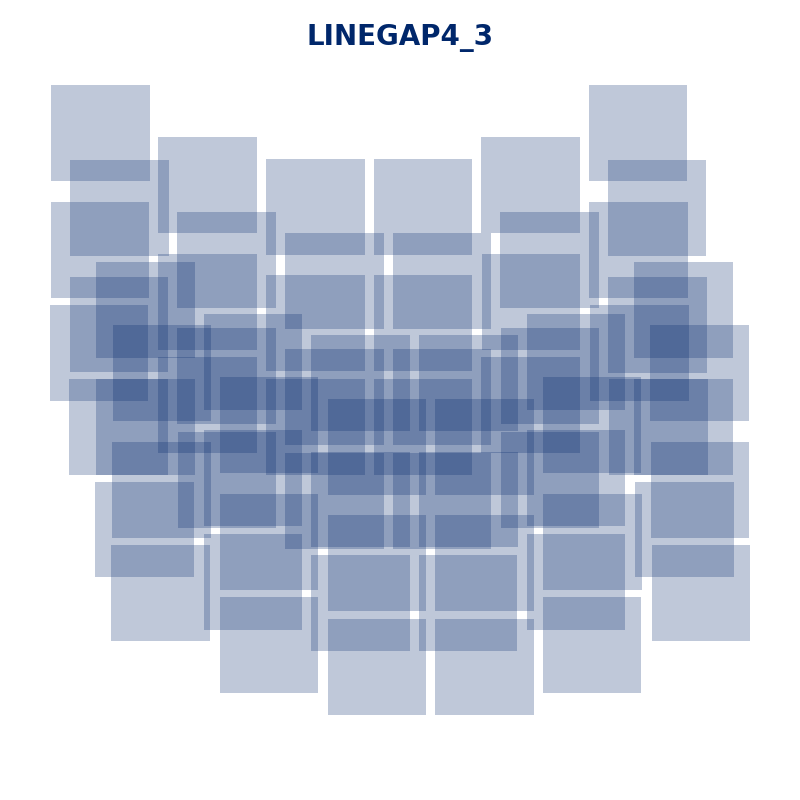
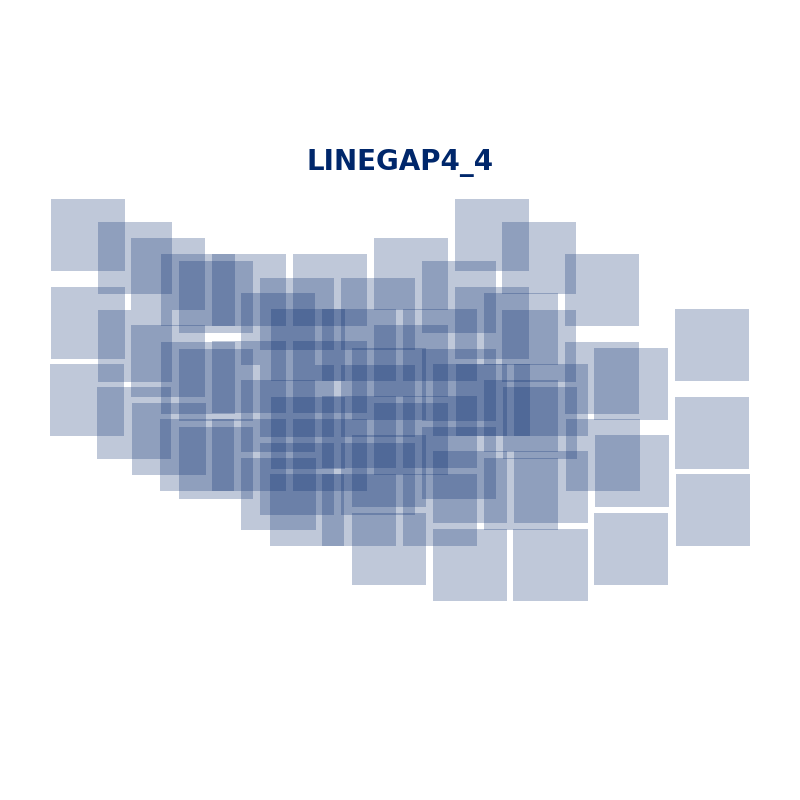
A schematic of the four different LINEGAP4 dither patterns is shown. The WFI footprints, each composed of 18 detectors, are transparent so that the overlapping parts of the footprints build up maps of the coverage as the transparency approaches the full color.
Figure of BOXGAP4 Dither Patterns
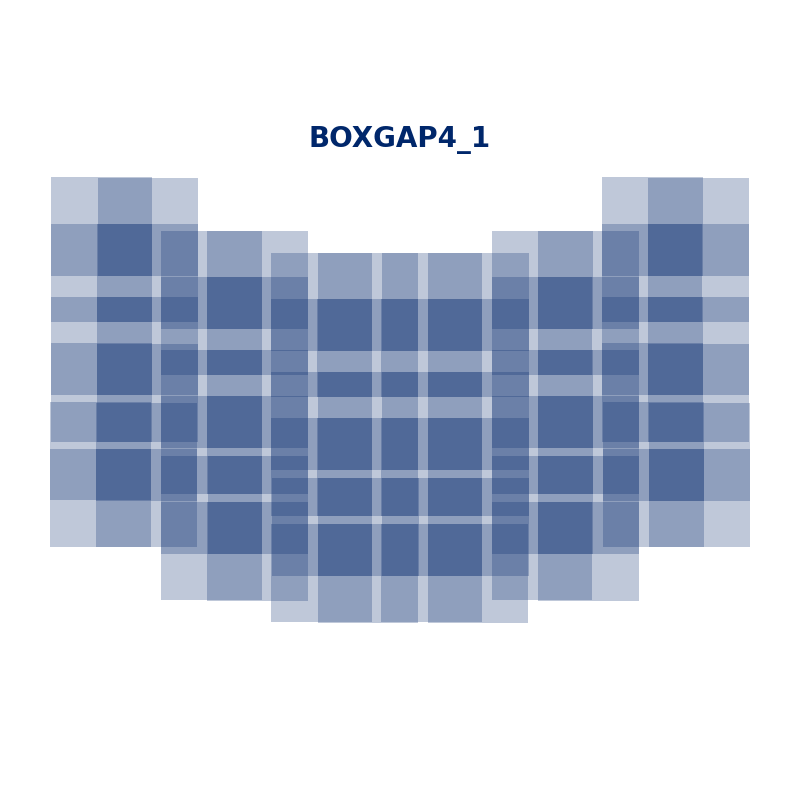
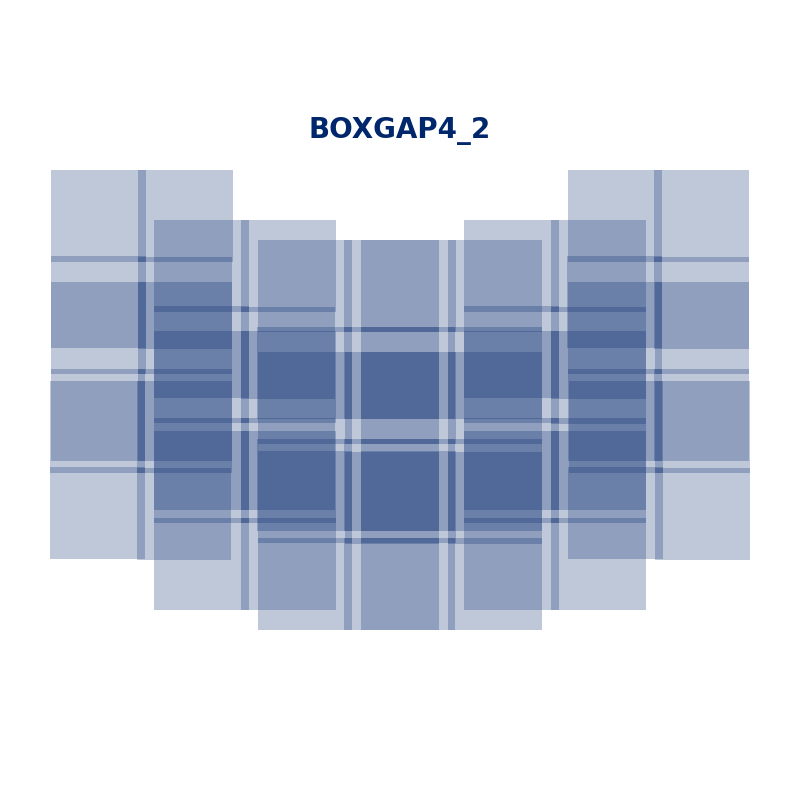
A schematic of the two different BOXGAP4 dither patterns is shown. The WFI footprints, each composed of 18 detectors, are transparent so that the overlapping parts of the footprints build up maps of the coverage as the transparency approaches the full color.
5 Point Dither Patterns
Figure of LINEGAP5 Dither Patterns
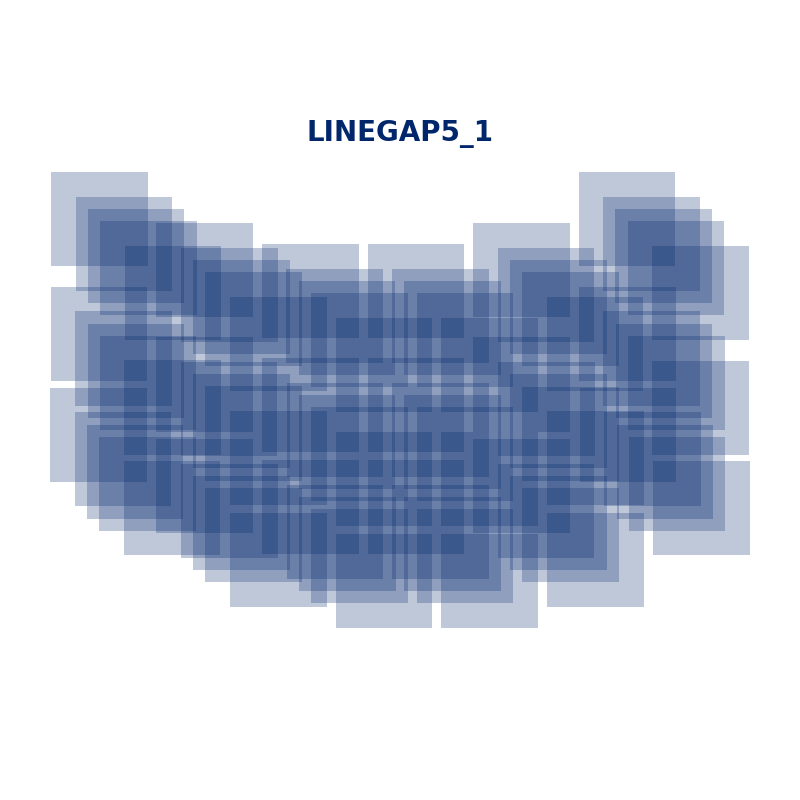
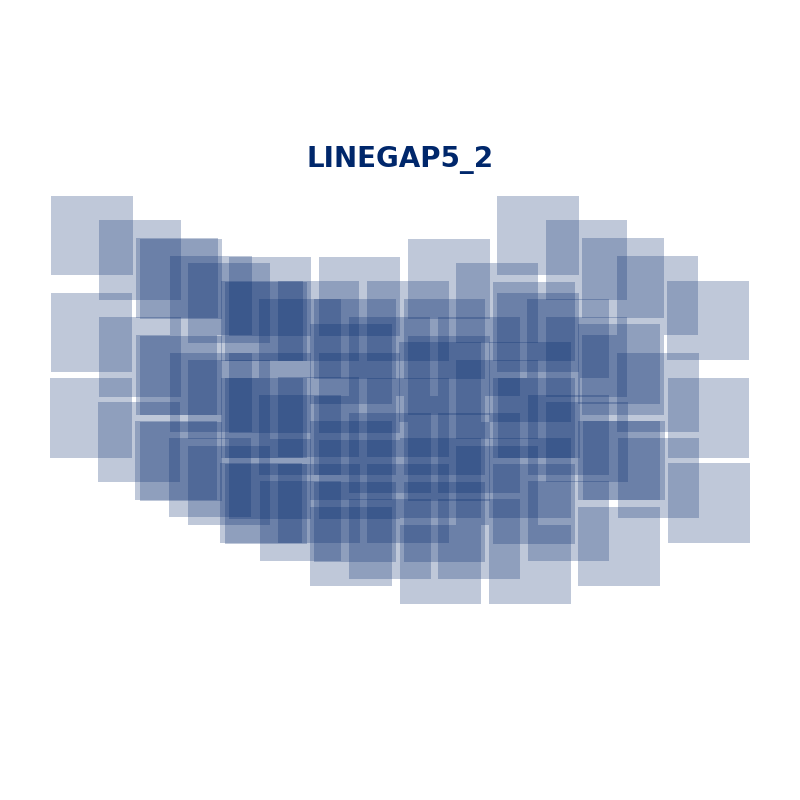
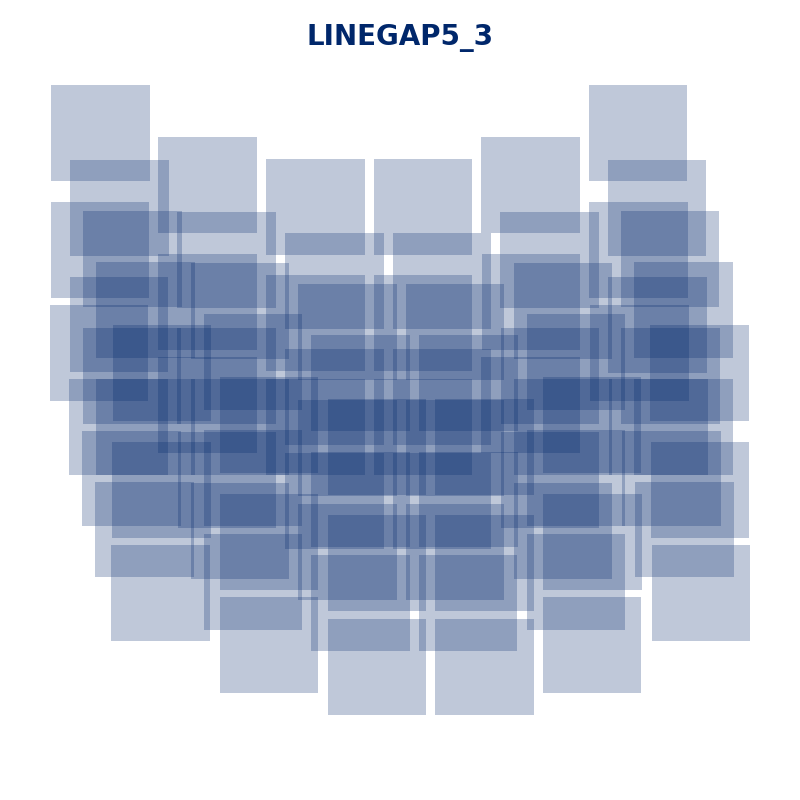
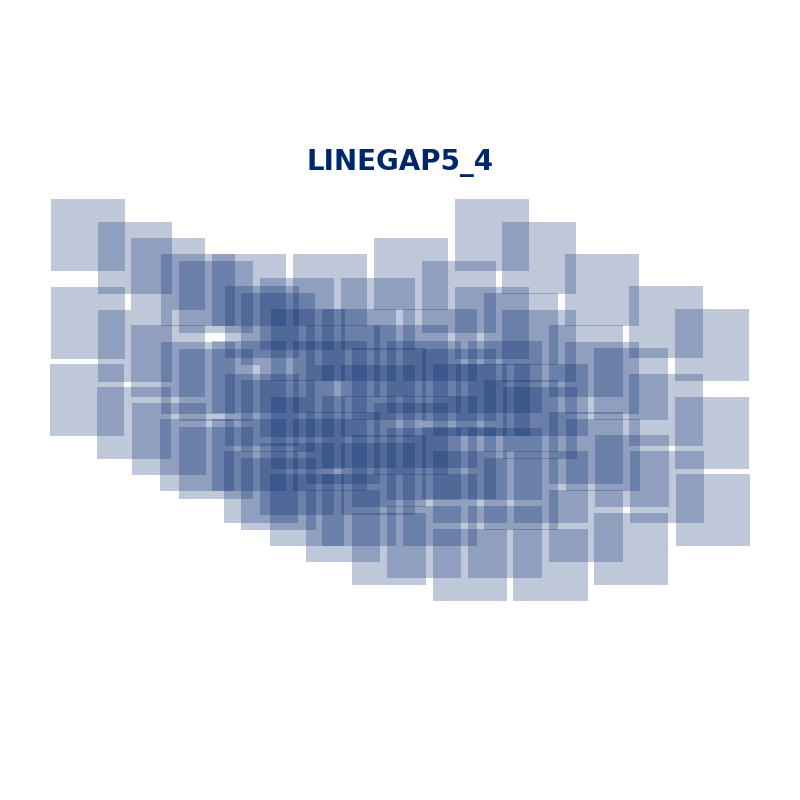
A schematic of the four different LINEGAP5 dither patterns is shown. The WFI footprints, each composed of 18 detectors, are transparent so that the overlapping parts of the footprints build up maps of the coverage as the transparency approaches the full color.
Figure of BOXGAP5 Dither Patterns
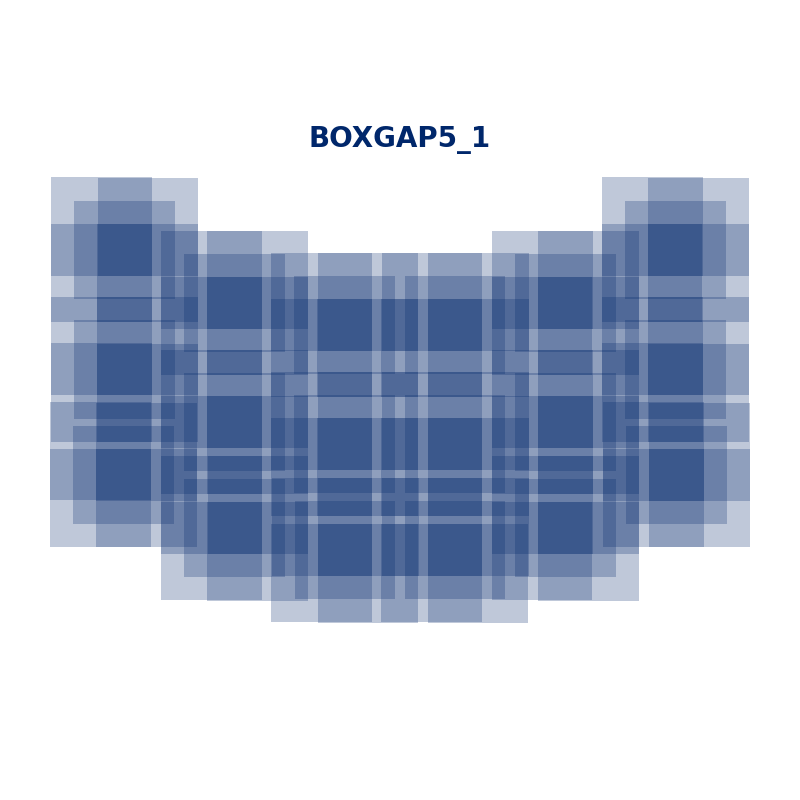
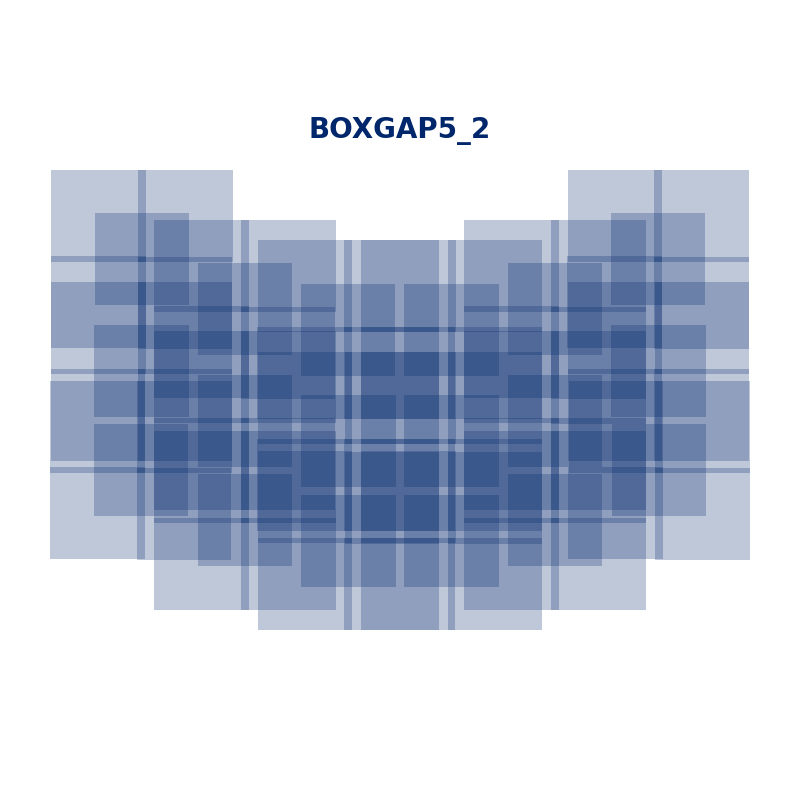
A schematic of the two different BOXGAP5 dither patterns is shown. The WFI footprints, each composed of 18 detectors, are transparent so that the overlapping parts of the footprints build up maps of the coverage as the transparency approaches the full color.
6 Point Dither Patterns
Figure of BOXGAP6 Dither Patterns
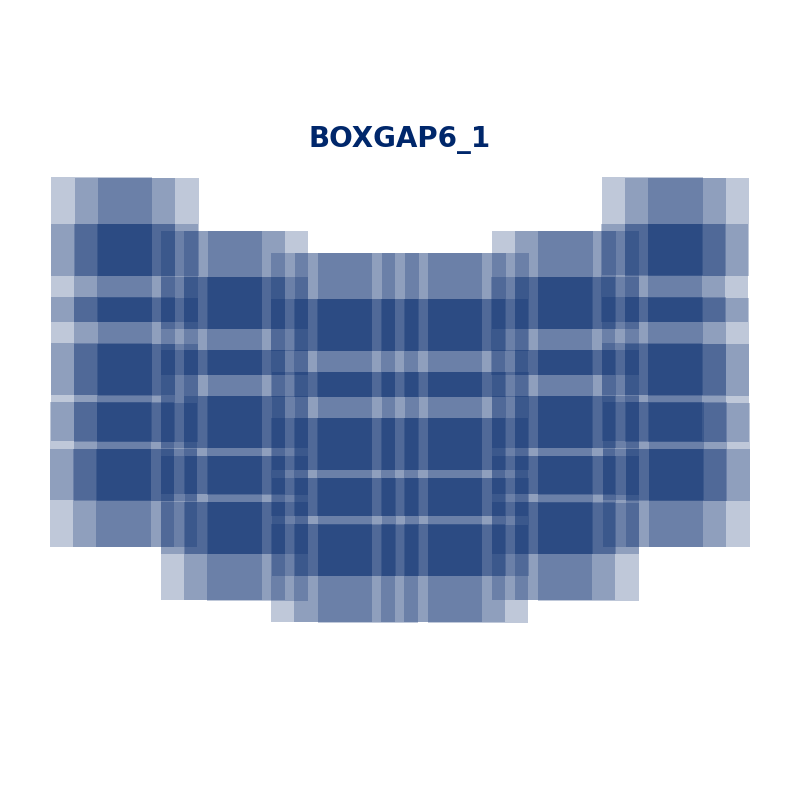
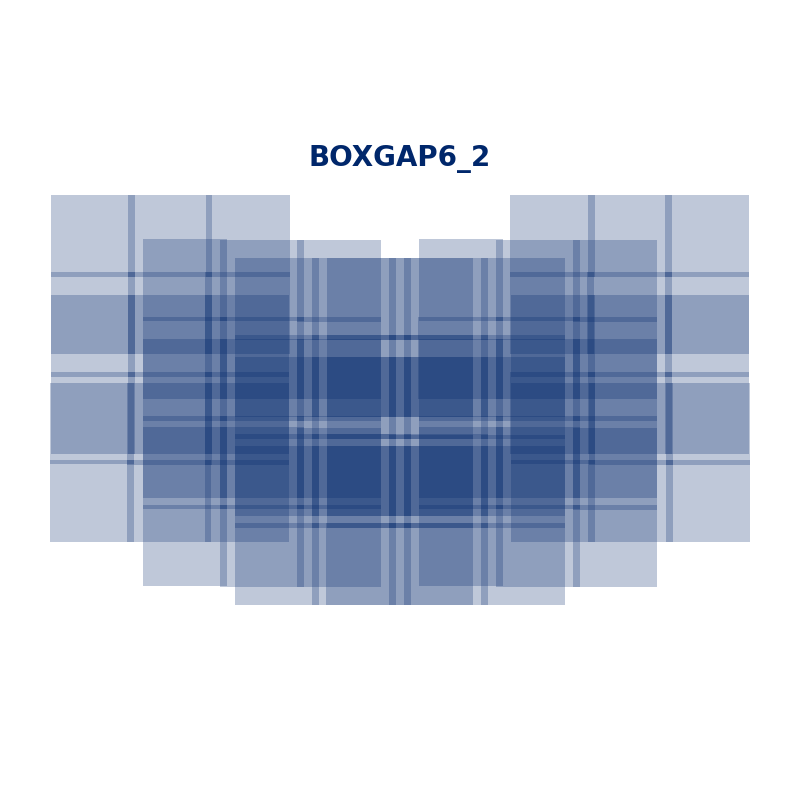
A schematic of the two different BOXGAP6 dither patterns is shown. The WFI footprints, each composed of 18 detectors, are transparent so that the overlapping parts of the footprints build up maps of the coverage as the transparency approaches the full color.
7 Point Dither Patterns
Figure of BOXGAP7 Dither Patterns
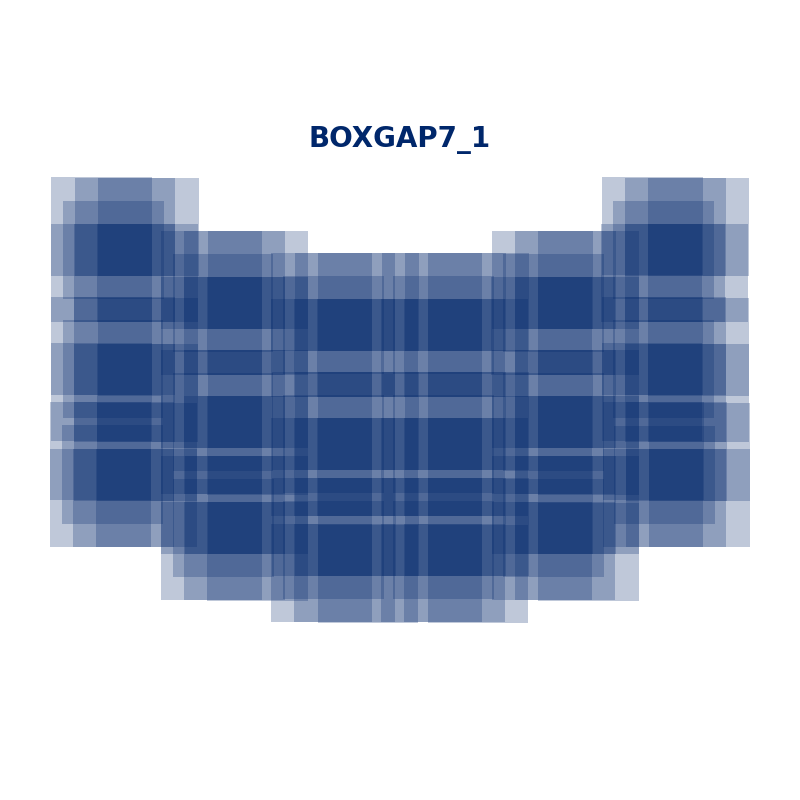
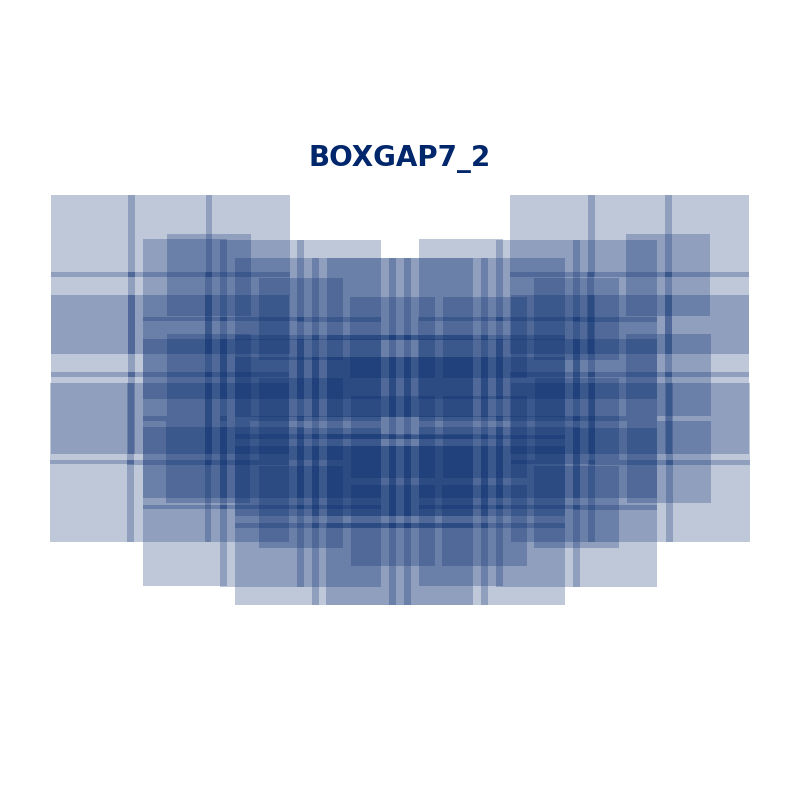
A schematic of the two different BOXGAP7 dither patterns is shown. The WFI footprints, each composed of 18 detectors, are transparent so that the overlapping parts of the footprints build up maps of the coverage as the transparency approaches the full color.
8 Point Dither Patterns
Figure of BOXGAP8 Dither Patterns
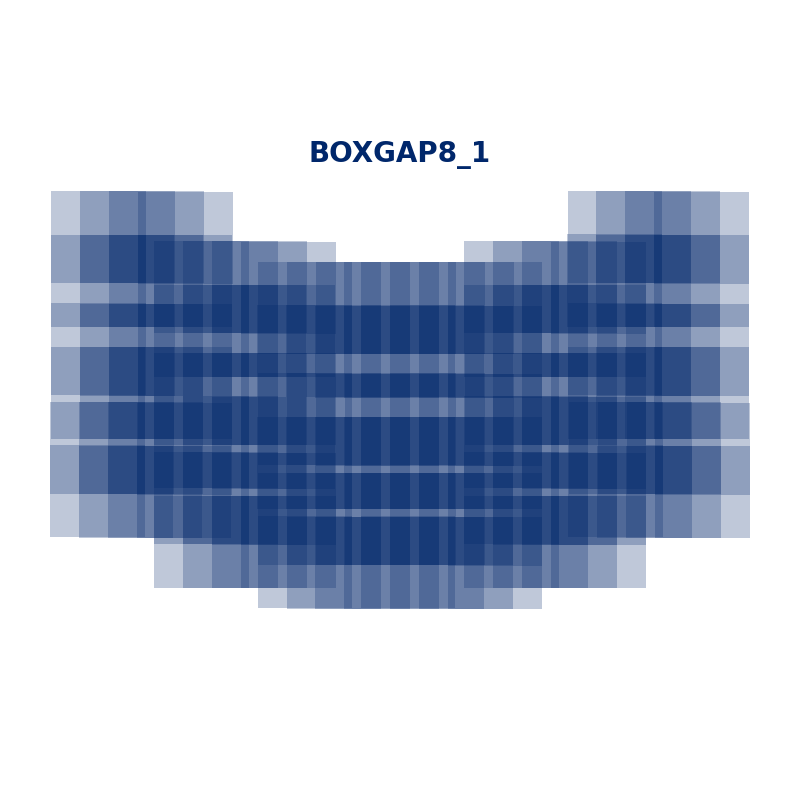
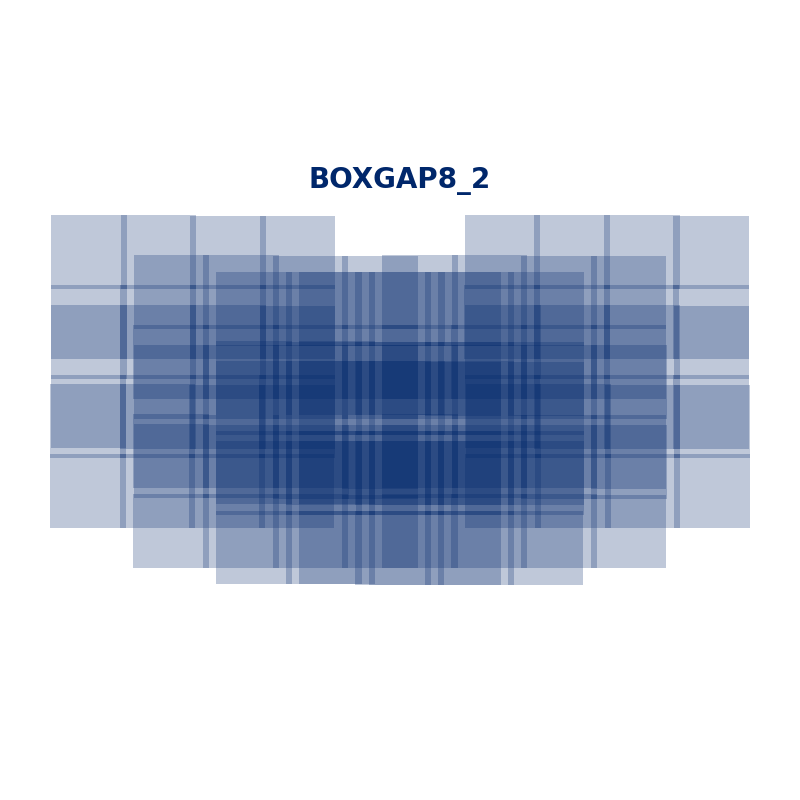
A schematic of the two different BOXGAP8 dither patterns is shown. The WFI footprints, each composed of 18 detectors, are transparent so that the overlapping parts of the footprints build up maps of the coverage as the transparency approaches the full color.
9 Point Dither Patterns
Figure of BOXGAP9 Dither Patterns
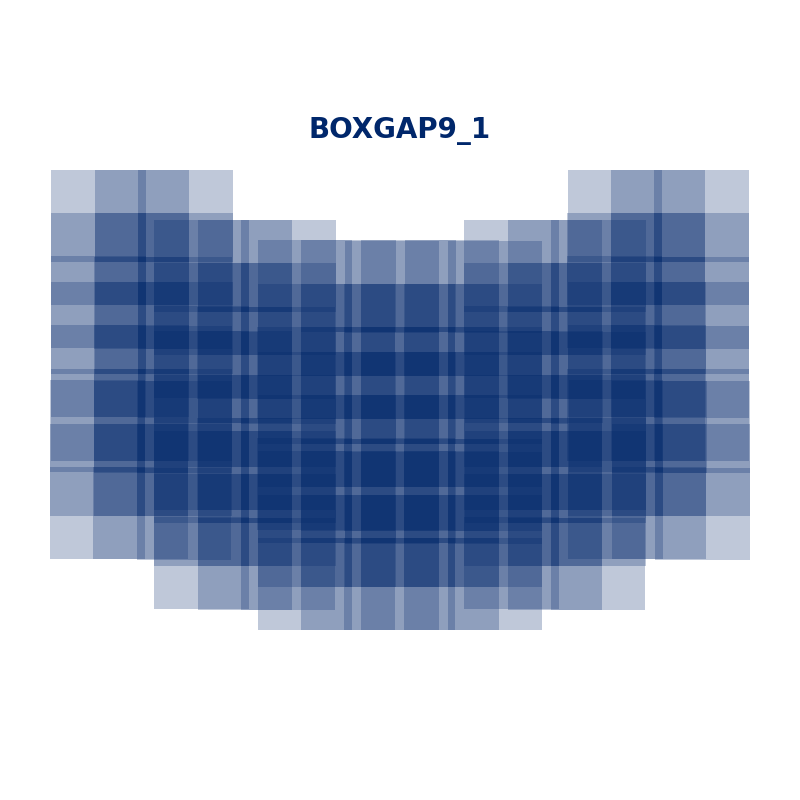
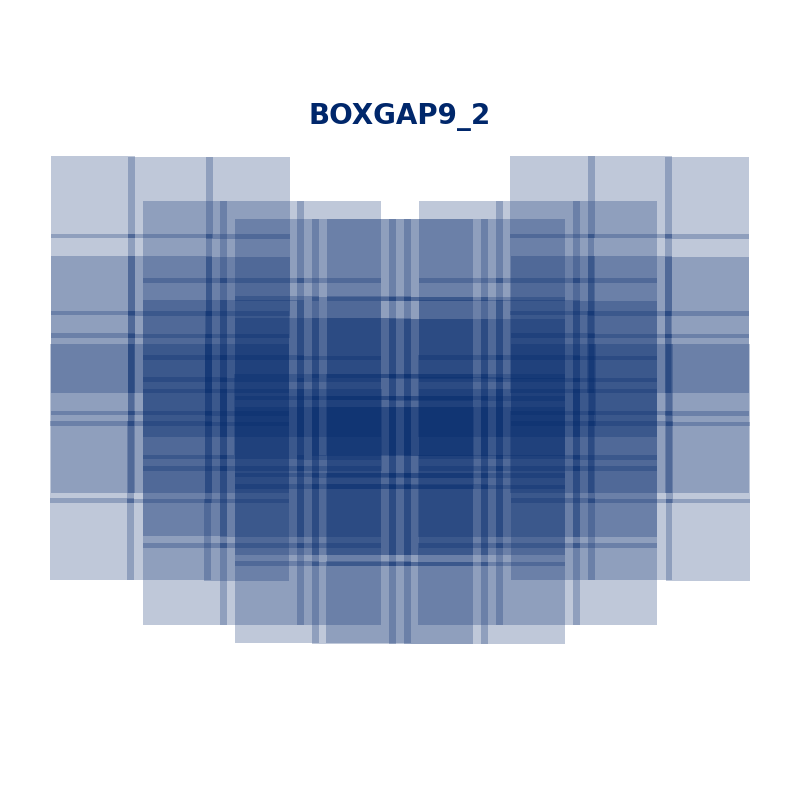
A schematic of the two different BOXGAP9 dither patterns is shown. The WFI footprints, each composed of 18 detectors, are transparent so that the overlapping parts of the footprints build up maps of the coverage as the transparency approaches the full color.
For additional questions not answered in this article, please contact the Roman Help Desk.